Thursday 27 December 2018

Hideous Stock Market

Issue No. 035 (Thursday 27 December 2018)

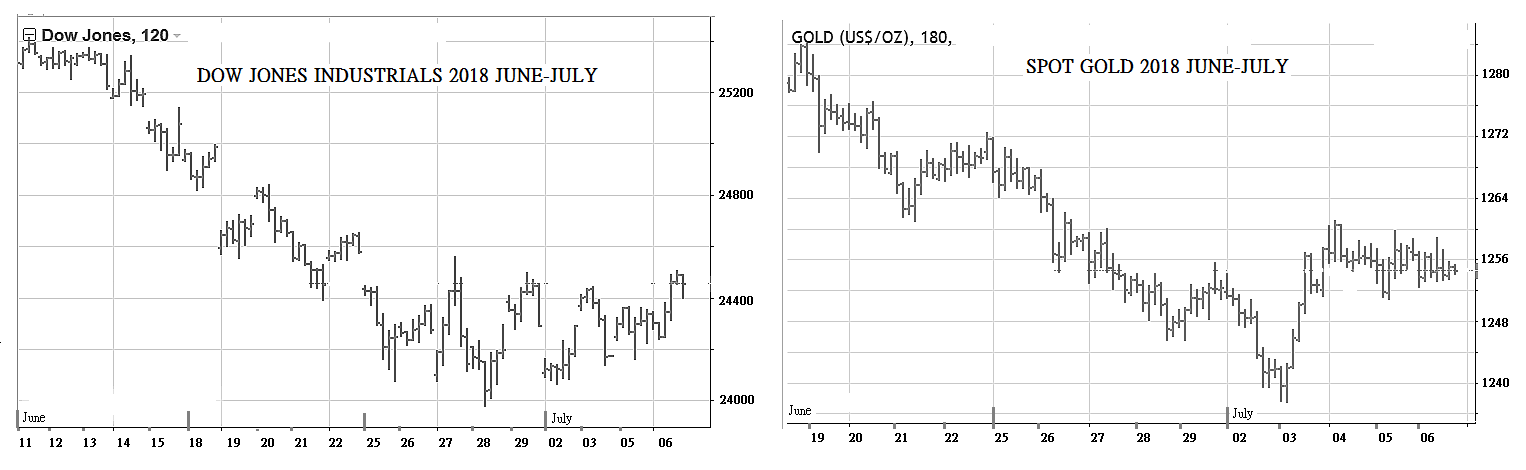
The DOW nose-dives in December, with a spectacular rally of 1,086 points (+4.98%) on Wed 26 Dec 2018, to close at 22,878.


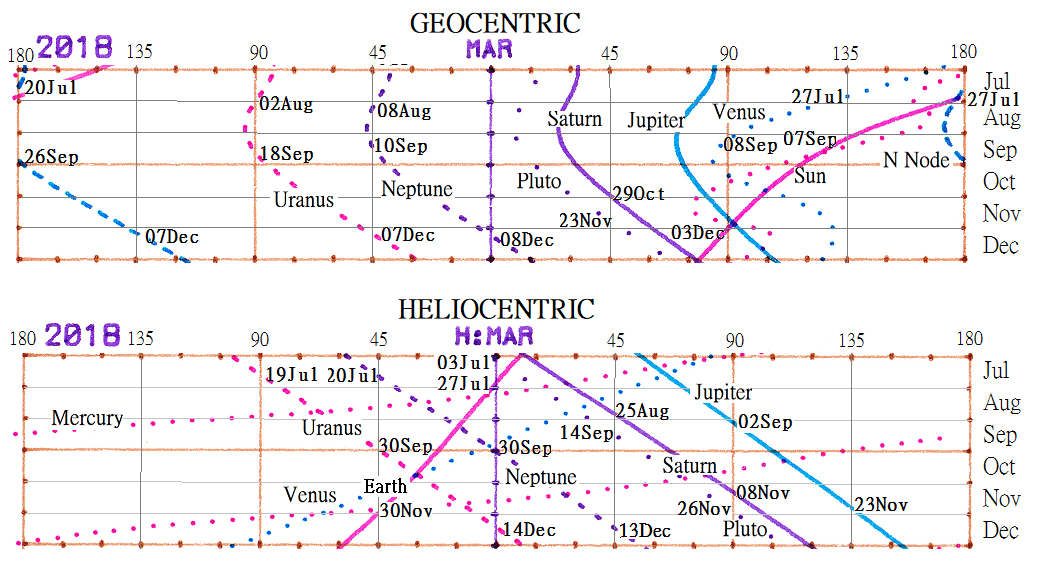
[AA]  BIRD’S EYE VIEW OF THE SOLAR SYSTEM

Chart A1 and Chart A2 are both dated 2018-12-28, to describe 2 bearish features:

Bearish feature on Chart A1
On Left Solar Chart 2018-12-28 Jupiter’s orbit at 900 (a bearish hard angle) in front of Jupiter is marked POIS 1 (Point of Intense Stress No. 1). POIS 1 is severely stressed by 2 hard angles formed of Giant planets (Sun, Jupiter and Saturn):
        Sun.POIS.Jupiter = 450
        Sun.POIS.Saturn = 900

Bearish feature on Chart A2
On Right Solar Chart 2018-12-28 Jup FT (Jupiter Fore Trojans – recessionary asteroids 600 in front of Jupiter) meet exactly with POIS 2 (Vertex of the bearish triangle):  
       ∠Jupiter.Jup FT.Uranus = 1350.     1350 = 450 x 3.

Jupiter Fore Trojans are severely de-stabilized by the hard angle of 1350 formed of 2 Giant Outer planets (Jupiter and Uranus).

Chart B1 and Chart B2 are both dated 13 Jan 2019 (Half month later). The bearish features are very similar. It means the negative features continue to exert bearish influence on the stock market for many weeks.

The joint efforts of these negative features are potent enough to sharply depress stocks in Dec 2018 and Jan 2019.


[BB]  GEOCENTRIC VIEW (Observations from the Earth)
There are more ugly planetary patterns present in Jan 2019.

The geocentric Jupiter-centered Ephemeris below reveals important interactions between Jupiter (bearish planet) with Uranus & Neptune (2 Giant neutral Outer planets):
        09 Jan 2019 [Uranus Sesquare Jupiter].  Sesquare = 1350.
        13 Jan 2019 [Neptune Square Jupiter].  Square = 900.
There is one more bearish aspect:
        01 Jan 2019 [Jupiter Sesquare N Node].
        Here N Node enhances the negative influence of Jupiter.

 The very harmful influences of these aspects are further invoked by Earth and Sun transits:
Earth transit (Heliocentric aspect)
        13 Jan 2019 [Jupiter Semi-square Earth].  Semi-square = 450.
Sun transits (Geocentric aspects)
        19 Jan 2019 [Uranus Square Sun]
This extracts bearish influence of [Uranus Sesquare Jupiter]
        19 Jan 2019 [Neptune Semi-square Sun]
This extracts bearish influence of [Neptune Square Jupiter]
        21 Jan 2019 [Sun Semi-square Jupiter]
        21 Jan 2019 [Sun Opposition Moon] Lunar Eclipse.

These interactions forebode a sharply plunging stock market in the first 3 weeks of Jan 2019.


[CC]  DECLINATION OF THE PLANETS & ECLIPSES
The bearish interactions of SECTION [BB] are exacerbated by Declination + Eclipses.
It so happens that there are 2 eclipses during this period:

Solar Eclipse 06 Jan 2019 [Sun Conjunction Moon]
Lunar Eclipse 21 Jan 2019 [Sun Opposition Moon]

The significance of Eclipses (when considered alone) is neither positive nor negative. The Eclipses simply make Moon and Sun transits more powerful.

In Jan 2019, Sun interacts with Jupiter aspects (aspects outlined in SECTION BB) forcibly. As the Jupiter aspects are sharply bearish on stocks, Eclipses greatly enhance the bearish influences. Eclipses are the last straw. Stocks crash.


[DD]  INVESTORS ARE INSULATED FROM SATURN (Positive Planet)
We have so far considered many bearish features. What about positive planets which can generate rising trends? The positive planets are Mars and Saturn.

Mars is NOT strong in the first 3 weeks of Jan 2019 (Refer to Mars-centered Ephemeris of Issue No. 32 dated 17 Nov 2018).

And Saturn is insulated from Earth investors. In this respect, refer to Solar Chart 2019-01-13 below:

The product of [AA] [BB] [CC] & [DD] is a recessionary period which covers Dec 2018 and Jan 2019. There are more bearish features thereafter to extend the bearish trend to Feb 2019 (we are going to discuss them in the next post).

It is quite normal, during a Great Depression, for stocks to nose-dive 40% in 2-3 months. We are in the middle of such a situation.


Saturday 15 December 2018

Point Of Intense Stress

Issue No. 034 (Saturday 15 December 2018)

In Issue No. 33 (2 weeks ago), we expect a rally for 3 weeks. But DJIA plunges from 25,538 to 24,100 (down 5.6% in 2 weeks).

The cause of the plunge does not relate to the planets. It is the result of intense stress on Jupiter’s orbit!
We also indicate in the last post that we’ll encounter a calamitous CRASH in Jan 2019.

It is more prudent to wait for 1 more week before pronouncing a definitive forecast.


Saturday 1 December 2018

Bullish Saturn Triangle

Issue No. 033 (Saturday 01 December 2018)

In Issue No. 032 (2 weeks ago), we foresee a “rally from end Nov 2018 for about 3 weeks”. DJIA does surge in the last week of Nov 2018.
The past forecast has been made basing on the geocentric patterns of the planets in end Nov-early Dec 2018.

We now go further to examine the planetary patterns from Bird’s eye view which reveals a sharply bullish Saturn 45-degree Triangle (in addition to the bullish geocentric aspects already discussed).

Enhancement of Bullish Saturn 45D Triangle by Mars joining the Triangle
The Saturn 45D Triangle is a medium term bullish aspect. Positive Saturn influence is conveyed to Earth investors through the 45-degree hard angle.

The bullish enhancement is achieved by Mars (in anti-clockwise motion) moving to the mid-point of Sun and Uranus. Now positive Mars becomes a part of the configuration depicted on Solar Chart 2018-12-13. Motivations on any of the planets (Mars, Uranus, Neptune and Saturn) arouse the positive influence of the Saturn 45D Triangle.

Enhancement of Bullish Saturn 45D Triangle by positive Declinations
The Sun’s latitudinal positions (red line) are under (at South of) those of Saturn (purple line) from 07 Dec 2018 to 07 Jan 2019. During this period the Sun is separated by Saturn from negative Jupiter (blue line) because Jupiter’s latitudinal positions are above those of Saturn. The Sun (Earth’s antenna) takes in positive Saturn influence from end Nov 2018 to early Jan 2019 enhancing bullish expectations.

The feature is bullish before exact parallel on 07 Dec 2018 because in end Nov 2018 (10 days earlier) the Sun’s declination is already close to the declination of positive Saturn.

The enhanced Saturn 45D Triangle will propel stocks upwards for about 3 more weeks.

WARNING: We’ll encounter a calamitous CRASH in Jan 2019.

=============================================================
For long term forecasts, please read my eBook which outlines stock movements from 
present to Jan 2021. Click THEORY OF EVOLUTION for the article.
=============================================================


Saturday 17 November 2018

Retrograde Mercury

Issue No. 032 (Saturday 17 November 2018)

We forecast a nose-diving stock market for the past 2 weeks. In fact stocks fall moderately.
There are several bearish features in the next 10 days. However, there is a single feature that can arrest the stock market’s decline -- it is Mercury moving backwards (as observed from the Earth). The backward motion of Mercury (moving from Left to Right as illustrated below) is a visual illusion, but it is significantly bullish on stocks.
Accordingly, stocks in the next 10 days will be erratic.
But I expect a rally from end Nov 2018 for about 3 weeks. The positive features which fuel the expected rally are described on the following 2 geocentric Ephemeris.

Bullish aspects as depicted on the Mars-centered Ephemeris are
03 Dec 2018 [Mars Square Sun].  Square = 900.
07 Dec 2018 [N Node Sesquare Mars].  Sesquare = 1350.
                        [Uranus Square Mars]
08 Dec 2018 [Neptune Conjunction Mars].  Conjunction =00.
Bullish aspects as depicted on the Neptune-centered Ephemeris are
30 Nov 2018 [Neptune Sesquare Venus].
06 Dec 2018 [Neptune Square Sun]
07 Dec 2018 [Neptune Conjunction Mars]

Aspects described on the Neptune Ephemeris create Melody (sweet music).  Neptune is the Musician, and Venus is the Dancer. The sounds of their interactions are melodious.  Mars is a positive planet, and an active Mars erases any negative force. In addition, Sun joins to stimulate these aspects.

Thereafter, the Great Depression will resume, from end Dec 2018.
==========================================================
For long term forecasts, please read my eBook which outlines stock movements from present to Jan 2021. Click THEORY OF EVOLUTION for the article.
==========================================================


Saturday 3 November 2018

Rebound is validated

Issue No. 031 (Saturday 03 November 2018)

Our forecast of Issue No. 031 (1 week ago) says:-
“Stocks’ slide will continue into Nov 2018, though there may be a rebound in end Oct-early Nov 2018”.

Stocks’ rebound from Tuesday (30 Oct) to Friday (02 Nov 2018) is sharp, and its magnitude (in Asian markets) is spectacular. The “good” news is a tweet (on Thu 01 Nov 2018) that President Trump has a long and very good conversation with Xi of China - their talk has a heavy emphasis on trade.  Stock traders cheer the news like final cease fire on trade conflicts. I don’t interpret news, but the rally is clearly revealed by planetary patterns conducive to market sentiments.
Positive feature on Saturn-centered Ephemeris
[A]   Exact on Mon 29 Oct 2018 [Mars Semi-square Saturn].
        Both Mars and Saturn are bullish planets of the Solar System.
        When they are stimulated, stocks rise.

Positive feature on Pluto-centered Ephemeris
[B]   Exact on Sat 03 Nov 2018 [Pluto Semi-square Mercury].
        Pluto is also a bullish planet. Pluto is made active by Mercury.
Together with [A], all 3 positive planets of the Solar System (Mars, Saturn and Pluto) join hands to push up stocks.

Positive feature on Neptune-centered Ephemeris
[C]   Exact on Sat 03 Nov 2018 [Neptune Sesquare Venus (Retrograde)].
        This aspect is supported by Uranus 450 (a hard angle) in front of Neptune.
        Neptune is the Musician.
        Venus is a Dancer.
        Mercury of [B] is a Singer.
        Therefore, a Melody Formation is present to help create the stock market rally.

These bullish aspects converge in end Oct-early Nov 2018. Upon stimulation by Moon transits, stocks jump.

But there are BIG BEARS lurking in the background (as explained in the post 1 week ago). We re-produce the Table below.

Be prepared for a nose-diving stock market in the coming 2 weeks.

=======================================================================
For long term forecasts, please read my eBook which outlines stock movements from present to Jan 2021. Click THEORY OF EVOLUTION for the article.
=======================================================================


Thursday 1 November 2018

Stock market forecast - revised


My article to forecast stocks from present to Jan 2021 has been revised.
Click THEORY OF EVOLUTION to access the article.


Saturday 27 October 2018

November is bearish also

Issue No. 030 (Saturday 27 October 2018)

As expected, DJIA continues to fall precipitously in the past 2 weeks.

Stocks’ slide will continue into Nov 2018, though there may be a rebound in end Oct-early Nov 2018.

I am significantly bearish for the first half of Nov 2018 (except for possible rebound in early Nov). The reasons for my bearish views are disclosed in the Jupiter-centered Ephemeris.

Bearish aspects are marked on the Ephemeris. These aspects are again presented in Tabular form below.

One more negative feature is revealed on Solar Chart 2018-11-07 (Wednesday, day of New Moon).

But there will be a rally from end Nov 2018.  Stay tuned.


Saturday 13 October 2018

Great Depression of 21st Century

Issue No. 029 (Saturday 13 October 2018)

As expected, DJIA falls precipitously in the past 2 weeks, ushering in The Great Depression of the 21st Century.

Stocks’ slide will continue in the coming 2 weeks, before a short rebound at end Oct 2018.

The reason for the bearish 2-week (commencing 15 Oct 2018) is revealed on Solar Chart 2018-10-24

Abnormally deleterious influence of Jup FT will be aroused on Wed 24 Oct 2018:
  @00:34 Uranus Conjunction Earth
  @09:37 Earth Square Jup FT
  @23:57 Uranus Conjunction Venus.

These interactions are marked on the Solar Chart.
On Wednesday, Uranus is brutally attacked by BOTH Earth and Venus. The aspect [Uranus Square Jup FT], involving Uranus, is goaded to devastate the stock market – Jup FT (Jupiter Fore Trojans) are recession asteroids creating economic Depression when they are under severe stress, as in present case.

A Moon is added on the Solar Chart to show:
Fri 26 Oct 2018 @14:50 [Jupiter Opposition Moon].

Accordingly, the Sun-Jupiter System is thoroughly shaken up – on full de-stabilization of Jup FT (by Earth) as well as Jupiter (by Moon). A stock market collapse is anticipated.

The heliocentric Jupiter-centered Ephemeris (below) offers an alternative way to study the sharply bearish situation.

The planets are viewed from the Sun -- Jupiter (blue vertical line) is plotted at the center, with all other planets moving on either side of Jupiter.

The critical point is 1500 in front of Jupiter (where Uranus is). Uranus is 900 in front of Jup FT. i.e. [Uranus Square Jup FT]. Jup FT are 600 in front of Jupiter.

On 24 Oct 2018 Uranus is fiercely attacked by both Earth and Venus. The interactions completely de-stabilize Jupiter Fore Trojans, creating a nose-diving stock market.

To further plague the market, Moon joins the bearish interactions on 26 Oct 2018 by [Jupiter Opposition Moon].

##

In the next post, we’ll discuss what makes 2018 November month bearish also.


Saturday 29 September 2018

Imminent Crash

Issue No. 028 (Saturday 29 Sep 2018)

We expect DJIA to rally to historic high which is reached on 21 Sep 2018 (exceeding the previous high by 153 points).

But a Stock Crash is coming in Oct 2018, as depicted on Solar Chart 2018-10-08. The bearish aspects are marked on top of the Chart.

Heliocentric bearish aspects are
08 Oct 2018 [Neptune 105 Jupiter]
which is [Neptune Semi-square Jup FT]
12 Oct 2018 [Uranus 150 Jupiter]
 which is [Uranus Square Jup FT].

Jup FT (Jupiter Fore Trojans – recessionary asteroids 600 in front of Jupiter) are thoroughly de-stabilized by 2 Giant Outer planets (Neptune & Uranus) at the same time, and stocks nose-dive in Oct month 2018.


Saturday 15 September 2018

DJIA to surpass record high

Issue No. 027 (Saturday 15 Sep 2018)

We have been positive on stocks for Sep month 2018. For reasons, please refer to last post (Issue No. 026).

For the 2nd half of Sep 2018, there are 2 additional bullish reasons.

Additional bullish reason #1
A thick line is drawn from Sun to Neptune. Venus and Mars (revolving in anti-clockwise direction) are moving into the thick line. These planets together form a Gravitational Wall (“GW”). It is a bullish GW because Mars is a bullish planet while others are neutral planets.

The bullish GW is supportive to the stock market. It performs another function – It segregates bearish Jupiter from Earth (where investors are). Negative influence from Jupiter is obstructed by the GW from flowing to investors on the other side of the GW. Less negative influence to investors means higher stocks.

Additional bullish reason #2
Saturn when energized is significantly bullish to stocks. On Solar Chart 2018-09-25, Saturn is at the Vertex of 2 sharply positive Triangles.
        Saturn 45D Triangle Uranus.Saturn.Neptune = 450.
        Saturn 90D Triangle Sun.Saturn.Neptune = 900.
Saturn is pulled by 3 neutral Giant planets (Sun, Uranus and Neptune are Giant planets). Motivation is needed to bring out bullish Saturn influence.
Motivation is achieved by [Saturn Square Sun] exact on 25 Sep 2018 as described on the geocentric Saturn-centered Ephemeris. Fast Sun is moving to 900 behind Saturn, and thereby energizing Saturn. The last week in Sep 2018 is covered by the bullish influence emitted from Saturn.

DJIA is expected to reach a peak in end Sep 2018.

Saturday 1 September 2018

Bullish September

Issue No. 026  (Saturday 01 Sep 2018)

We have been positive on the U. S. Stock market (though trade conflicts harm Hong Kong stocks).

We continue to be optimistic because of a strong Mars in September month. An invigorated Mars can erase negative influence, and propel stocks upwards.

Two graphs are presented for readers.
At the top is a Mars-centered Ephemeris as viewed from the Earth.
The one below is a Mars-centered Ephemeris as viewed from the Sun.

Bullish aspects are those stimulating Mars, positive to stocks. Hard angles (multiples of 450) are needed to stimulate Mars.

The bullish aspects are listed hereunder:

As whole September month has an invigorated Mars, DJIA should advance to historic height.


Saturday 18 August 2018

Foreseeable optimism

Issue No. 025  (Saturday 18 Aug 2018)

Our last post (2 weeks ago) opines that stocks will encounter headwinds in the following period:  
       19 Aug 2018 ± 10 days.

This is true of markets in Asia (HK & China stocks plunge) but DJIA manages to stay afloat. Despite being at the middle of the bearish period as suggested, we can however foresee significant rises in the near future.

The Mars-centered Ephemeris below is marked (with red circles) the timing of the positive period – end Aug to mid Sep 2018.

Bullish features are:
[a] Mars moves forward to make hard angles with Uranus (900) & with Neptune (450).
[b] Fast planets are running after Mars to urge Mars (through hard angles) to act positively.
        -- Venus is stimulating Mars at 900 behind Mars.
        -- Sun is stimulating Mars at 1350 behind Mars.

I expect DJIA to climb new highs before collapsing later in the year.

The Dow closes last Friday at 25,669. The all-time high is 26,616 in Jan 2018.


Saturday 4 August 2018

Cautiously bullish

Issue No. 024  (Saturday 03 Aug 2018)

We have been bullish on US stocks in the past few months. We are now cautiously positive because we’ll soon encounter headwinds.

On Solar Chart 2018-08-19 Jupiter Fore Trojans (Jup FT – asteroids 600 in front of Jupiter) are severely afflicted by the Gravitational Wall (GW) formed of a line joining Jupiter and Neptune. This is de-stabilization of Jup FT. Jup FT are recession asteroids.

The exact date of Jup FT de-stabilization is 19 Aug 2018, and the bearish period covers:

        19 Aug 2018 ± 10 days.

US stocks are expected to plunge during this de-stabilization period.

However, bullish Mars is also strongly stimulated during the same period – Refer to the explanation of past 2 posts. Bull and Bear meet, with the outcome of a volatile US stock market in the next 3 weeks.

I am preparing a FREE PRIMER for Stock Market Forecast which will soon be uploaded @ Smashwords.

End of post


Saturday 21 July 2018

Theory of Evolution

Issue No. 023  (Saturday 21 July 2018)

I’ve just published an ebook which can be accessed by clicking (Control + Click) the title below:

        Theory of Evolution (an Innovative Approach to Stock Market Forecast)


In the last issue, I forecast sharply rising markets for DJIA and for Spot Gold.
DJIA has gone up significantly, while Gold falls then rebounds in the last 2 trading days. 

I re-post last issue’s geocentric Mars-centered Ephemeris showing consecutive stimulation on positive Mars from end July to end Sep 2018 which is a favorable period for BOTH Stocks and Gold.

I am giving a precedent to validate the assertion. The precedent indicates consecutive motivations on Mars by Inner planets (like the present scenario), and stocks rally.
 End of post


Saturday 7 July 2018

Fireworks ahead

Issue No. 022  (Saturday 07 July 2018)

Trade conflicts between US & China cause market jitters. But the markets are set to rally sharply.

The rally period covers 3rd week of July 2018 to end Sep 2018, as indicated on the geocentric Mars-centered Ephemeris below.

From end July to end Sep 2018 there are 2 positive medium term features:

        [Uranus Sesquare Mars]. Sesquare = 1350.
        [Neptune Square Mars]. Square = 900.

Short term agitations on Mars are by fast moving planets (Sun, Mercury and Venus) behind Mars and moving towards Mars. The salient aspects are:

27 July 2018 [Mars Opposition Sun]. Opposition = 1800.
         This aspect is powerful. Expect rise to begin 1 week before exact Opposition.
07 Sep 2018 [Mars Sesquare Sun]. Sesquare = 1350
09 Sep 2018 [Mars Square Venus]. Square = 900.

These bullish spots are marked by red circles and red ellipses.

Stocks and Gold will rally from 3rd week of July 2018.