Stocks continue to advance in the past 2 weeks, contrary to
expectations.

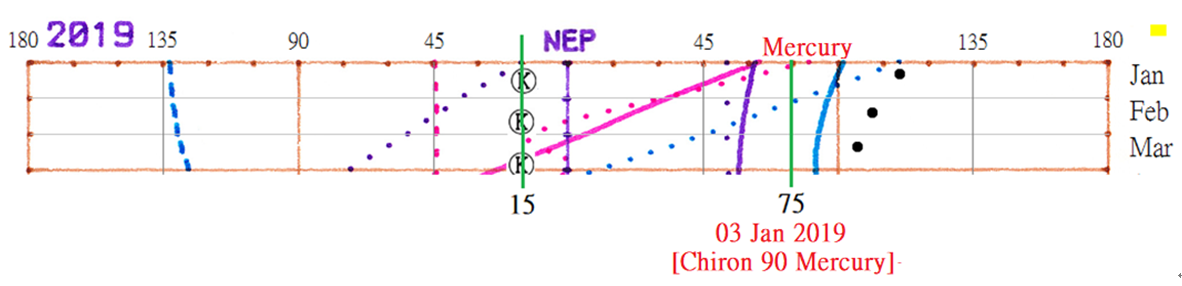
The reasons for the rising market
(in Jan 2019) are heavy stress on positive Mars and heavy stress on positive
Saturn, through 2 Giant neutral Outer planets, at a hard angle of 450
(Semi-square).

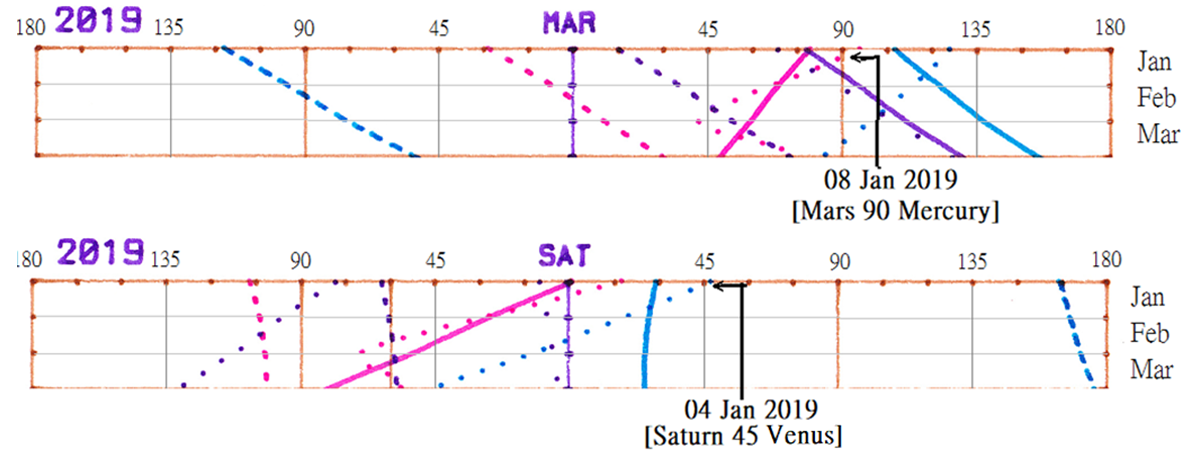
On Solar
Chart 2019-02-14, there are 2 positive Triangles:
Mars 45D Triangle: ∠Uranus.Mars.Neptune = 450.
Saturn 45D Triangle: ∠Uranus.Saturn.Neptune = 450.
Bullish Mars and Bullish Saturn are at the
Vertices of the Triangles, and they are simultaneously stressed (pulled) by Uranus
and by Neptune.
These Triangles are effective in 2019 Q1.
Their combined bullish influence has inspired the rally in January. Since they continue to be effective in
February and March 2019, the stock market will be supported, and any downward
adjustments will be shallow.
We jump to end Mar-early Apr 2019 to see
whether there are changes to adversely affect the market.

Solar
Chart 2010-04-04 discloses a special feature - “Changing
partners”.
BULLISH Saturn 45D Triangle: ∠Uranus.Saturn.Neptune = 450.
Is being replaced by:
BEARISH Jupiter 45D Triangle: ∠Uranus.Jupiter.Neptune = 450.
The Triangles are at the initial
stage of changes. As they are made up of slow moving planets, the change is a
slow process.

When we study the Solar Chart from
a different perspective, the change (from Bullish to Bearish) is obvious.
There are three (3) sharply bearish
features marked on Solar Chart
2019-04-04:
Bearish
feature One
Saturn is posited at 900 in
front of Jup AT (Jupiter Aft Trojans - recessionary asteroids). Tiny Jup AT
(being faster) are rushing to smash against Saturn (Giant planet) and thereby
Jup AT get de-stabilized. Saturn in this interaction is relatively stable
because when Massive Saturn clashes with Tiny asteroids, Saturn hardly
oscillates. The active Jup AT (bearish) influence is conveyed to Earth
investors (not the positive influence of Saturn). In present case, Saturn’s function is
negative because Saturn helps de-stabilize bearish asteroids.
Thus,
Saturn 45D Triangle is turned bearish, leaving Jupiter 45D Triangle to ravage the market.
Bearish
feature Two
Draw an imaginary line from Saturn to Jupiter,
and extend the line outwards. That line of force pierces through Jup AT (600
behind Jupiter). Jup AT are de-stabilized.
Bearish
feature Three
In her anti-clockwise motion, the Earth is
moving to 600 behind Jupiter, exact on 04 Apr 2019. This is [Jup AT
Conjunction Earth]. Again Jup AT are thoroughly de-stabilized.
Expect steep fall from end Mar 2019.